Charts Viewer
Description
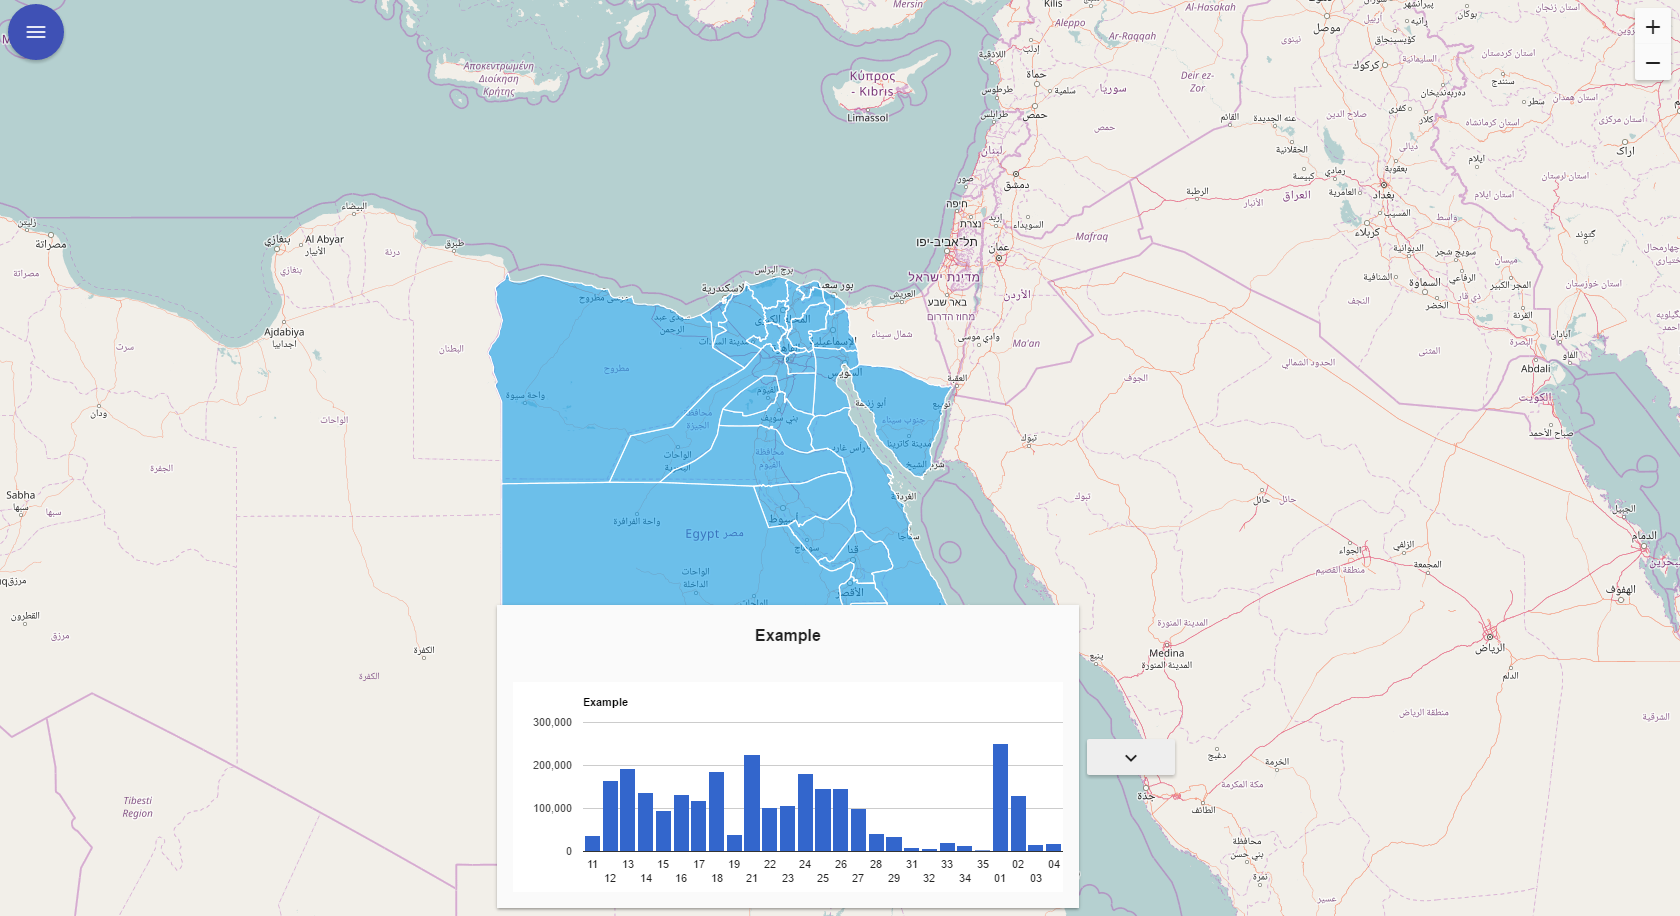
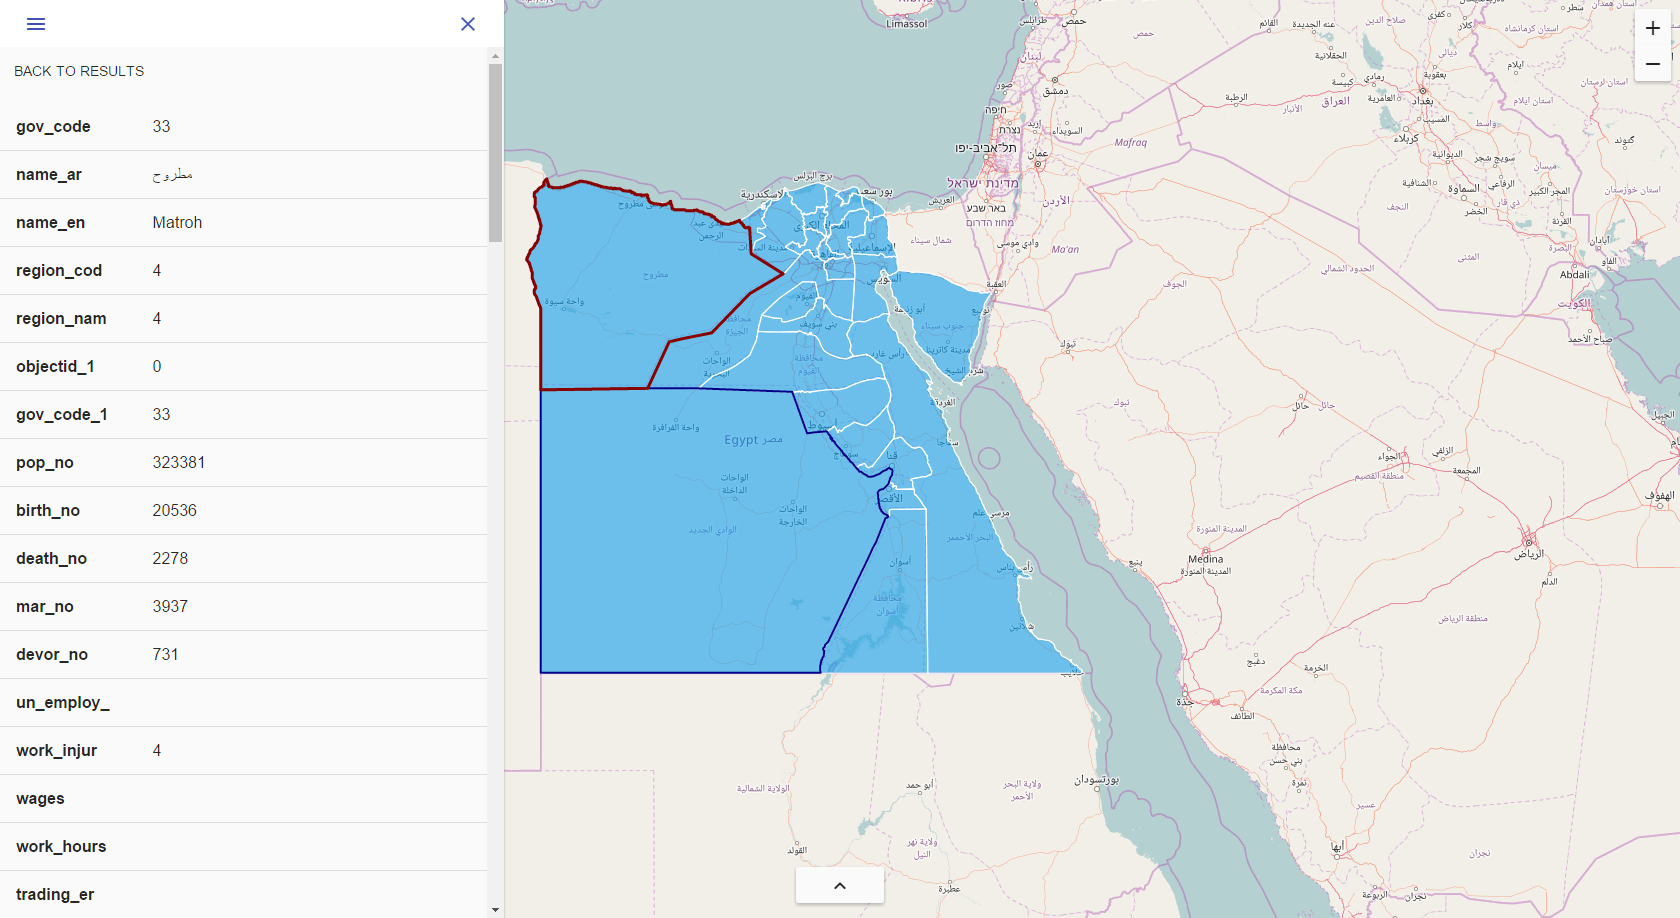
Creating charts for numeric attributes of features in a specified layer that fall in the visible map extent. The Charts can be configured to show the sum, average, minimum and maximum of specified field values..
Changelog
Installation Instructions
Login With


